
Google Ads IP exclusions can be bypassed. We did it.
What Google Ads advertisers should know about IP addresses used in fraud strategies Google Ads IP exclusions can be bypassed. We did it. TL;DR —

Yes. And more than Google wants to admit.
In a controlled experiment using practically identical keywords, we found that—keeping max bids, extensions, and the competitive environment constant—keywords with a Quality Score ≤ 3 paid up to 33% more per click than those with QS = 7.
Same search intent. Same competitors. Same bidding strategy (manual). Same bid. A single differentiating factor: “quality”.
Beyond the CPC increase, average position dropped from 1.28 to 1.64; the absolute top impression rate fell by 16%, and competitors outranked us 14% more often.
We’re not talking theory. We’re talking real money.
Yet for years Google has insisted that Quality Score “is not a factor that affects the ad auction,” but rather “a diagnostic tool that identifies how ads shown for certain keywords affect the user experience.” (Source)
Formally, that’s true. Operationally, it’s misleading.
Why this paradox?
In Google Ads there are actually two “Quality Scores”:
What Google says in its current documentation is that a keyword’s Quality Score is not used directly in the auction, BUT the ad quality signals (expected CTR, ad relevance, and landing page experience) used to estimate Quality Score still affect Ad Quality, which in turn affects Ad Rank and CPC:
So in theory, no—but in practice, yes. Quality Score isn’t used “as such” in the auction, but Ad Quality is; it impacts both position (Ad Rank) and what you end up paying per click (actual CPC); and the Ad Quality assessment is summarized in the Quality Score.
To remove any doubt about the strong relationship between the two, the main components of one are the components of the other:
In short: Google claims Quality Score isn’t an “input” in the ad auction, but acknowledges in its documentation that the three factors that define it—Expected CTR, Ad Relevance, and Landing Page Experience—are the “Big Three” (the three main components) of Ad Quality. For all practical purposes, a poor Quality Score is still associated with worse Ad Rank and a higher cost per click.
Let’s go back to the dawn of time. When Google AdWords launched (October 2000—i.e., the Upper Paleolithic), there was no Quality Score, no pay-per-click, nothing. Advertisers paid per impressions (CPM).
In 2001, Google began testing the CPC model. The Metal Ages emerge.
In 2002 we enter the Neolithic: ranking is based on bid × estimated CTR, under a version of the Generalized Second Price:
Ad Rank = Max CPC * Estimated CTR
Actual CPC = (Ad Rank of the next competitor below you) / (your estimated CTR) + $0.01
= (Max CPC of the competitor below you) × (their estimated CTR) / (your estimated CTR) + $0.01
This incentivized a high CTR, which has remained the most relevant factor in auction outcomes ever since (together with Max CPC). You can find more details on the Neolithic in the paper by Edelman et al. (2005).
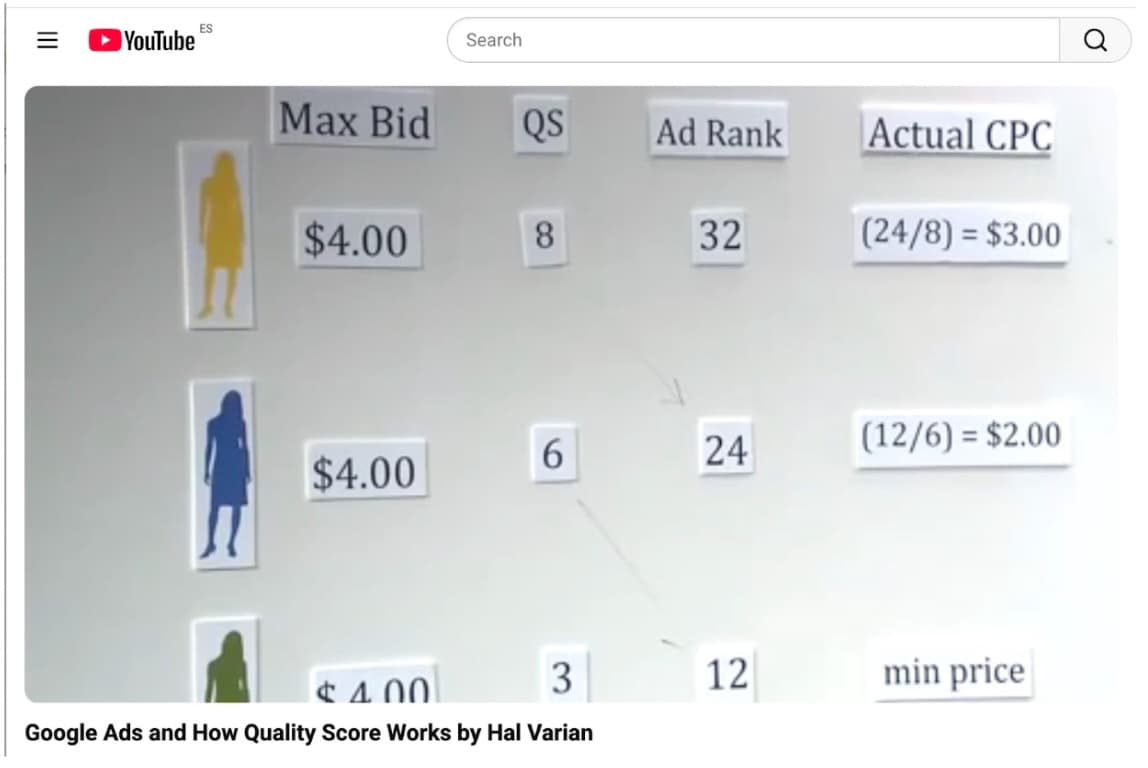
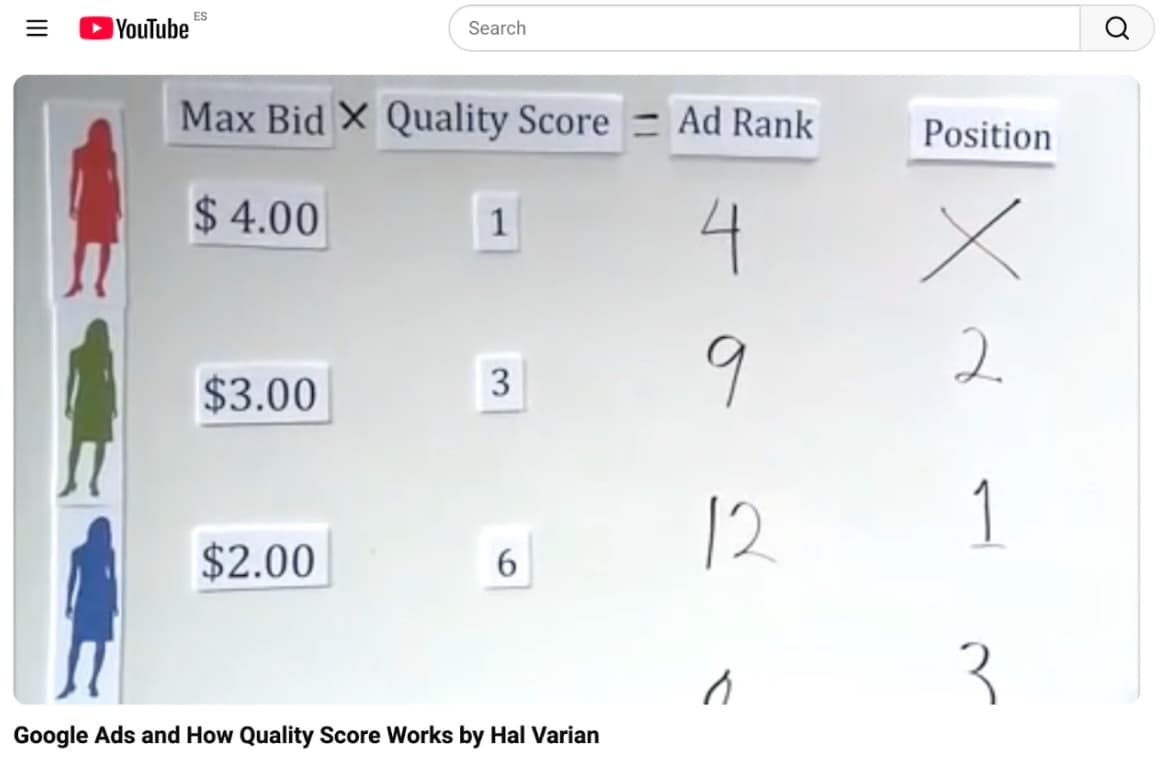
In July 2005, Google formalizes the concept of Quality Score (source). We enter Antiquity. Ad Rank and actual CPC are now described as:
Ad Rank = Max CPC * Quality Score
Actual CPC = (Ad Rank of the competitor below you) / (your Quality Score) + $0.01
= (Max CPC of the competitor below you) × (their QS) / (your QS) + $0.01
In practice it’s very similar, but to CTR (still the core factor) other components are added, such as landing page quality and load speed. For more details on this period, you can read Hal Varian’s paper Position Auctions (2007)—Varian was Google’s Chief Economist from 2002 to 2025.
In August 2008, Google announces changes to how Quality Score is calculated: it is now evaluated in real time for each search (source). This is the moment when the “invisible” Quality Score (what Google actually uses in each auction, recalculated dynamically) begins to diverge from the “visible” one (more static, tied to each keyword with a 1–10 value).
Conceptually, however, we remain in Antiquity. Hal Varian would record in 2009 a key video to understand how the Google Ads auction worked.
In this video, Varian not only shows the Ad Rank and actual CPC formulas above, but also the relative weight of each Quality Score component. Although he does not provide exact numbers, the frame below suggests Expected CTR ~ 60%, Relevance (keyword + ad) ~ 30%, Landing Page ~ 10% (rough visual estimate).
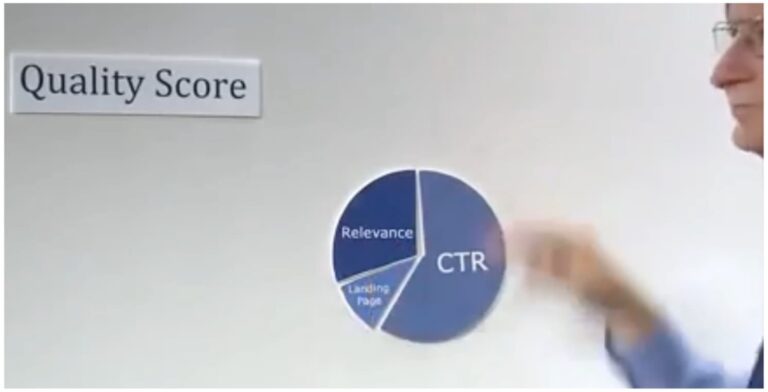
This is Google’s announcement, and here is the link to the video.
In July 2013, when announcing changes to Quality Score reporting at the keyword level, Google clarifies that this does not change the real-time QS for each auction and therefore does not affect performance. This already points to: “your 1–10 number is reporting/diagnostic, not the engine of the auction” (source).
Three months later, Google announces that Ad Rank will also consider the expected impact of extensions and formats (in addition to bid and quality). From that point on, the explanation “Ad Rank = bid × QS” is incomplete even as a simplification:
“Ad Rank improvements: […] Previously, Ad Rank was calculated using your max CPC bid and your Quality Score. With this update, Ad Rank will also take into account a third component: the expected impact from your ad extensions and formats.” (source).
These two changes set the stage for what would come a year later—the foundation of the current model.
In a post published in June 2014, Hal Varian sets the modern thesis: Quality Score as a diagnostic tool that reflects (but is not a direct measure of) Ad Quality. The post is accompanied by a link to the paper Settling the (Quality) Score (2014), which reaffirms the new paradigm:
“Quality Score Is a Helpful Diagnostic Tool, Not a Key Performance Indicator. Why: Your Quality Score is like a warning light in a car’s engine that shows how healthy your ads and keywords are. It’s not meant to be detailed metric that should be the focus of account management.”
“Pay Attention to the “Big Three” Component Parts of Ads Quality. They are: ad relevance, expected CTR and landing page experience. Why: The real-time evaluations of these three components are used in the ad auction, while your Quality Score itself is not.”
Settling the (Quality) Score. (Google, 2014)
Google’s Chief Economist also publishes a new video listing the factors that influence the Google Ads auction. Expected CTR is still first, and he introduces something new compared to his 2009 video: the impact of “ad formats” (ad extensions).


In this video, Varian no longer shows formulas to calculate Ad Rank or actual CPC; Quality Score has been replaced by (Ad) Quality; and the parameters are purely qualitative (high/medium/low).
The calculations become a black box: you have to take Google’s assigned actual CPCs on faith, because there is no way to reconstruct them.

Welcome to the Modern Age. This is, broadly speaking, the model that remains in place in 2026. Today, the model includes:
Historically, expected CTR has been the highest-weight component within quality, and there is no public evidence that this has changed substantially.
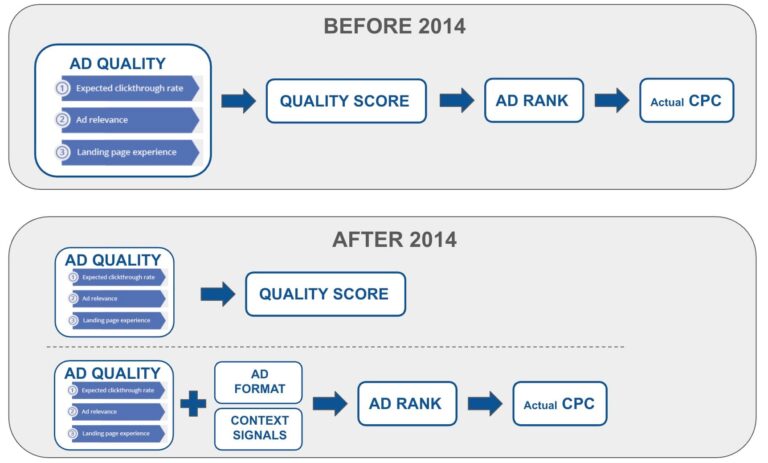
Paradigm shift in 2014: practically the same inputs, more opaque calculations, different outcomes.
To ensure strong internal validity, we used keywords with Google’s maximum allowed bid ($1,000 USD) and that share the same ad extensions and the same competitors.
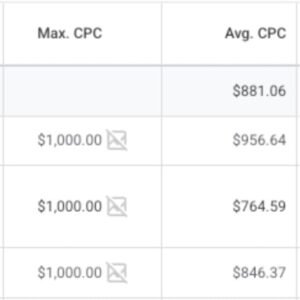
Example bids for some keywords in the experiment
In this way, observable differences in ranking among them are determined almost exclusively by their Ad Quality (the “almost” is because we cannot control competitors’ actions—but given the same sector, same vertical, same players, and very similar keywords, competitor bids should be very similar across keywords, and any isolated differences should wash out in aggregate across the dozens of keywords analyzed).
We ran the experiment using data from the last 180 days (August 20, 2025–February 15, 2026), totaling 20,097 impressions.
The results of our experiment are captured in Tables 1 and 2 below.

Table 1
Methodological note: the average position has been estimated using the formula
∑ competitors (impression share × outranking rate)competitor +1
In other words, every metric is worse for keywords with lower Quality Score: lower average positions, a smaller share of first positions, and a higher cost per click.
The fact that everything deteriorates simultaneously dampens the apparent effect of a poor Quality Score on each factor in isolation. When one variable is held constant, the real impact becomes clearer. Thus, when we compare keywords with the same absolute top rate (Abs. Top), actual CPCs were 33% higher for the low-QS keywords.

Table 2
This experiment has high internal validity due to the large volume of data, the use of manual bidding, and the exceptional choice to fix bids at the maximum value allowed by Google, which eliminates noise introduced by bid differences themselves.
However, its external validity (in other accounts) is limited to qualitative conclusions. We do not claim as a new universal standard that dropping five points in QS will increase costs by 33% or reduce average position by four tenths. The figures will depend on the specific case and moment in time. But we can state that, in any account, a poor QS will be strongly associated with worse positions and a higher cost per click. Improving the former notably—and observably—improves the latter.
In 2026, with the widespread use of Smart Bidding and broad match, and with Search campaigns losing relevance relative to the rise of PMAX, DemandGen, IAMax, etc., focusing on Quality Score may sound old-fashioned. But precisely because of today’s context—where we have less and less control over campaigns—this is one of the areas where we can still intervene and make a meaningful difference.
If your QS drops, Google will charge you more for the same outcome (or a worse one). So if your most important keywords have a poor Quality Score, do what you can to improve it by working on Expected CTR, Ad Relevance, and Landing Page Experience—both at the keyword level and at the campaign level. This will help you get more conversions and reduce costs.
But there’s more. In previous posts we discussed how to mitigate click fraud. In the coming weeks we’ll publish a new post about impression fraud: massive attacks from competitors who—through botnets—can generate tens of thousands of impressions without clicks to tank your Ad Quality, and with it your QS and Ad Rank, pushing you out of the top positions, reducing your chances of acquiring customers, and significantly increasing your CPC. This is exactly what seems to be happening to one of our clients, in whose account we’ve observed patterns consistent with this kind of behavior.
Don’t listen to what Google tells you. Listen to what Google charges you—and to your ranking versus your competitors.
What Google Ads advertisers should know about IP addresses used in fraud strategies Google Ads IP exclusions can be bypassed. We did it. TL;DR —

What Google Ads advertisers should know about duplicate GCLIDs and charges arising from invalid impressions What Google Ads advertisers should know about duplicate GCLIDs and

12.015 IMPRESSIONS, 0 CLICKS 12.015 IMPRESSIONS, 0 CLICKS A search campaign with Ad Relevance “Above Average,” a 48% Absolute Top rate, and a 95% Search
Can We Help You?
FÁKTICA ANALYTICS
Calle Núñez de Balboa, 35A
28001 Madrid
Spain
DATALYTICS
4 Portland Ct
St. Louis, MO 63108
USA

FÁKTICA ANALYTICS SL ha recibido una subvención por importe de 35.645,44 € del Ayuntamiento de Madrid, para la realización del proyecto de inversión denominado “Optimización del proceso de adquisición de clientes por PYMES mediante el uso de machine learning, big data, algoritmia y soluciones cloud. ”, con cargo a la convocatoria pública de subvenciones dirigidas al fomento de productos, herramientas o servicios de modernización tecnológica y digitalización, orientados a las PYMES y a la mejora de su competitividad, para la anualidad 2025, de la Dirección General de Economía del Área de Gobierno de Economía, Innovación y Hacienda
Ask Us for a No-Obligation Quote
Request a Traffic, Cost, and Potential Conversions Estimate
Ask About Our Pay-for-Performance Pricing
Get a Free Opportunities Analysis

Can We Help You?
Don’t hesitate to reach out to us